obrien_response
Analysis of "Molecular convergence in ex vivo models of Diamond Blackfan anemia"
Confounding in ex vivo models of Diamond Blackfan anemia
This repository contains all data and analyses performed to assess potential confounding of the transcriptomic ex vivo profiles examined in O’Brien et al. due to variability in cell type composition. Below is a roadmap to our analysis framework as well as a synthesis of our results.
Raw Data
All raw microarray samples (.CEL files) can be found in the data subdirectory. For our analyses, we reprocessed the data produced in O’Brien et al., which is contained under accession GSE89540. To develop and evaluate samples of transcript profiles we turned to the folowing datasets:
- GSE22552 from Merryweather-Clarke et al.
- GSE24759 from Novershtern et al.
- GSE41817 from Ludwig et al.
Analyses
All analyses were performed in R, and all code to reproduce our findings is contained within
the code subdirectory. While the
raw .R scripts are contained and can be executed
after cloning or downloading this repository, we’ve rendered summary webpages of our analyses
for ease of understanding the analyses performed.
Data import / preprocessing
To ensure the validity of our findings, we performed all normalization and down stream analyses using two different flavors of preprocessing. Each mode used primarily either RMA through the oligo package or the SCAN package. We performed batch normalization using COMBAT as implemented in the sva package We also used the limma package to establish gene signatures for each reference cell type composition from controls.
- RMA normalization summary webpage and corresponding Rscript
- SCAN normalization summary webpage and corresponding Rscript
Differential Expression Analyses
Here, we used the limma package to investigate key transcripts in each of the RMA and SCAN processed samples for both studies that had investigated differential expression between erythroid cells from DBA and control samples using microarrays.
- Differential expression summary webpage and Rscript
CIBERSORT
To estimate the per-sample cell type composition, we classified each sample using a support vector regression framework as previously implemented in CIBERSORT. As CIBERSORT was originally distributed through a web interface, we implemented their approach locally in this Rscript for convenience and reproducibility.
- RMA normalization summary webpage and corresponding Rscript
- SCAN normalization summary webpage and corresponding Rscript
Gene Set Analyses
For each of the major gene sets discussed in this correspondence, we’ve created a separate analysis script to characterize and compare enrichments. We investigated both typical GSEA results using the fgsea package and looked at the distributions of gene sets more directly. Specific hypothesis tests reported in the paper are also shown. We also create synthetic normals in the DE analysis code for each sample, which is the linear combination (%) of expression profiles of each control erythroid stage. We run GSEA on these synthetic normals directly and also use them to correct for cell type composition in the control and DBA samples from O’Brien et al. In particular, we find that these synthetic normals explain much of the GSE differences reported by O’Brien et al. when comparing DBA (RP/I) vs. Control and when comparing DBA (GATA1) vs. Control.
- Summary webpages for GATA1 targets, heme biosynthesis, ribosome biogenesis, and multiple genesets using GSEA and synthetic normal analyses
- Corresponding
.Rscripts for GATA1 targets, heme biosynthesis, ribosome biogenesis, and multiple genesets using GSEA and synthetic normal analyses
Processed Data
To speed up computational rendering at various stages and to ensure that our analyses were
reproducible, we generated several binary R objects contained in .rds files that are housed
in the processed subdirectory. These objects can be immediately read into the
R environment using the readRDS function.
Additionally, four .txt files are contained in the processed subdirectory
that contain the gene signatures for GSE22552 and GSE24759 under both methods of normalization.
Overall
In brief, these analyses suggest that the ex vivo samples produced by O’Brien et al. did not have identical cell composition, which we show can confound the association reported in this study. Moreover, our results suggest that the effects uncovered in their analyses can be attributable to cell type composition. The following figure summarizes our findings from a re-analysis of their data.
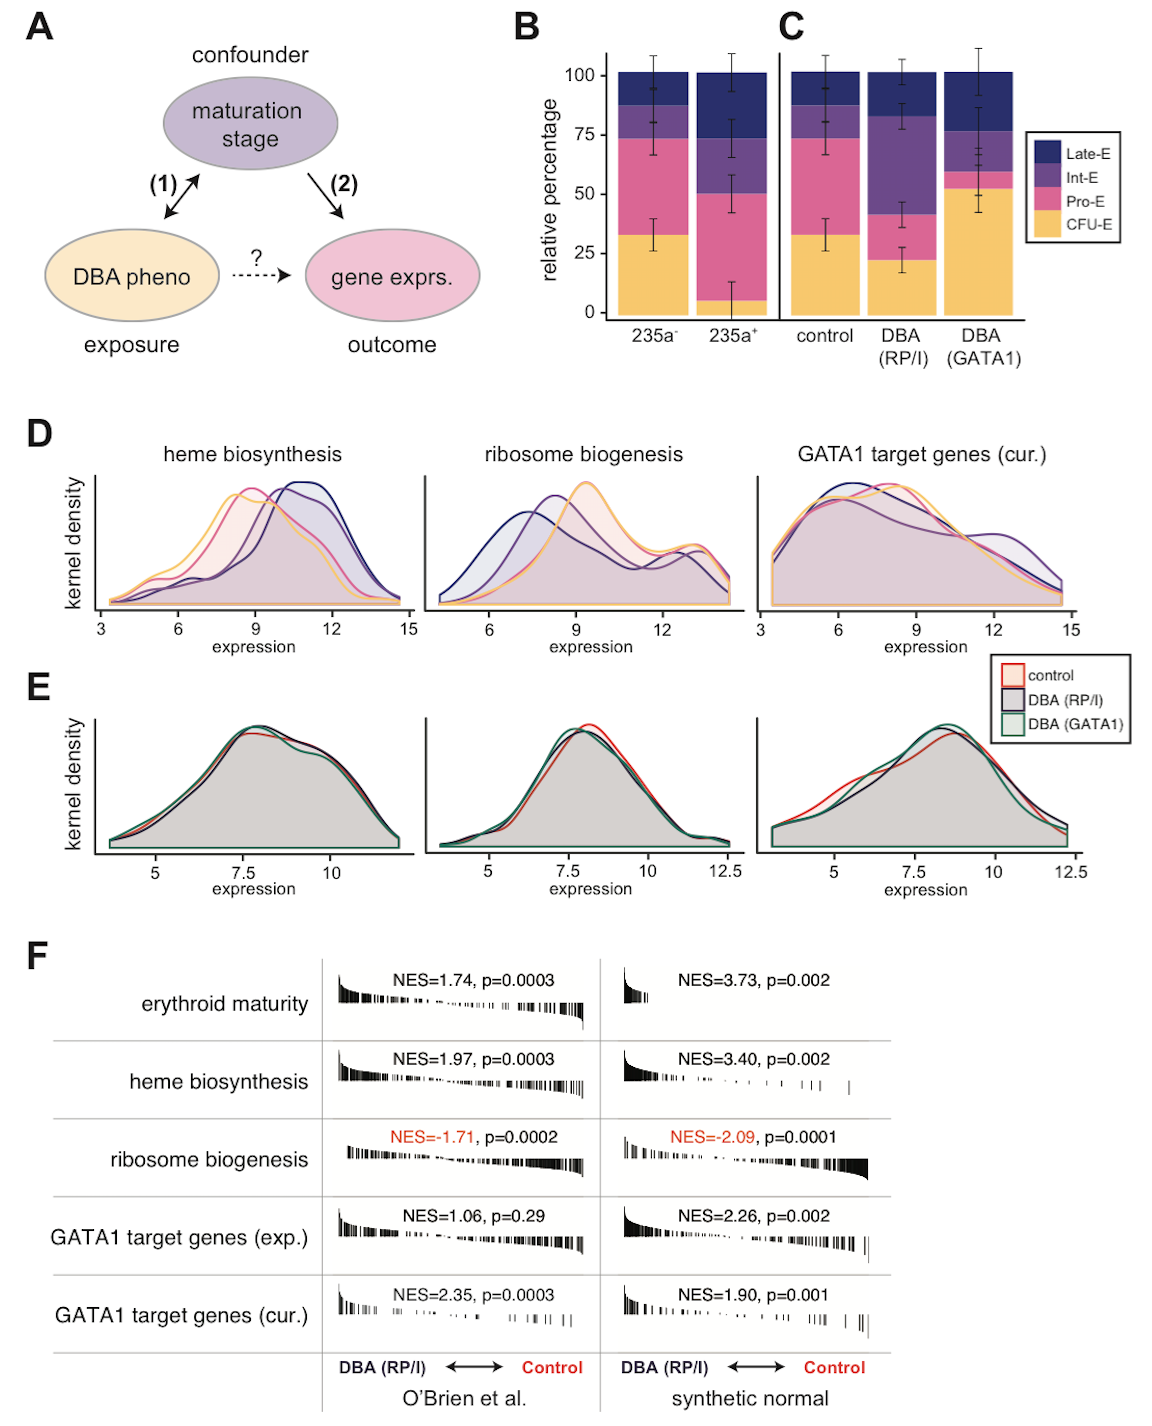 Figure 1. Evidence for confounding in microarray analysis of Diamond Blackfan anemia models.
(A) Diagram of hypothetical relationships between exposure, outcome, and putative confounding variable in the O’Brien et al. study. (B) Accurate deconvolution of early (CD235a-) and late (CD235a+) erythroid maturation stages by CIBERSORT, a support vector regression approach, in O’Brien et al. samples based upon normal erythroid maturation from GSE22552 (p = 0.000057 from likelihood ratio test). (C) Although similarly sorted for CD235a-, DBA samples are comprised of different mixtures of maturation stages than unaffected control samples. DBA due to RP or indeterminate (RP/I) samples are on average more mature (p = 0.017 from likelihood ratio test), whereas DBA due to GATA1 samples are less mature (p = 0.012 from likelihood ratio test). (D) Kernel density plots for heme biosynthesis, ribosome biogenesis, and curated (cur.) GATA1 target genes. Heme biosynthesis and ribosome biogenesis are significantly associated with erythroid maturation stage (p < 10^-10 for both by Kruskal-Wallis), whereas curated GATA1 target genes are only significant by more sensitive pairwise GSE analysis tests (online). Ribosome biogenesis was chosen as a more general measurement of “translational machinery” since snoRNAs were not measured in all microarrays. (E) Similar to (D), except for the three groups investigated in O’Brien et al. Differences between genotype (RP/I, GATA1, or unaffected) are much smaller than between stages (Kruskal-Wallis p > 0.5 for all comparisons, but significant by pairwise GSE anlaysis available online). (F) Similar GSE analysis to that reported by O’Brien et al. is shown. Synthetic stage-matched normal samples were created using the estimate from (B) of the percentage of each erythroid stage present. GSE analysis indicates that these synthetic normals have equivalent or stronger GSE results when compared directly to the original samples. Black bars indicate genes that are ranked according to expression differences between DBA (RP/I) and unaffected controls and normalized enrichment scores (NES) are reported. All data presented in this figure was RMA-normalized (see online analysis for SCAN-normalized).